
EMC32 file reader
Read, plot and compare plain text and binary format EMC32 output files with these two scripts
EMC32 software
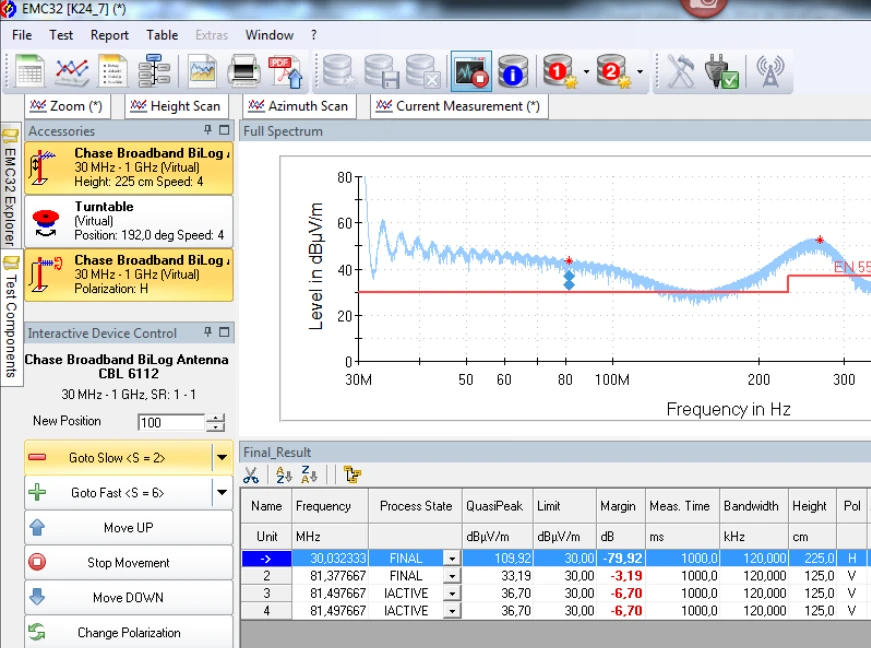
EMC32 is a software developed by Rohde & Schwarz to connect anechoic chamber instruments to computers and laptops. It's a good tool every electrical engineer has encountered during his professional life, even though it's gradually substituted by newer softwares.
Since this is a proprietary tool, some functions cannot be used outside the software and the user must run it to make comparisons, changes, analysis on experiments data. To avoid this, I wrote two scripts that allow you to read and plot the results of previous scans. The two scripts run under Python3.x environment and they need matplotlib to work; the first one takes plain text output file from EMC32, whereas the second one uses binary data files. Copy the script you need according to the mode you use to save data.
Plain text plotter
If you saved data in EMC32 folder structure as plain text, use the following script. Keep the folder structure as ECM32 did, don't touch anything since the script look for the files automatically. Place this script in the top level folder, at the same level as the EMC32 experiments directories.
0
1
2
3
4
5
6
7
8
9
10
11
12
13
14
15
16
17
18
19
20
21
22
23
24
25
26
27
28
29
30
31
32
33
34
35
36
37
38
39
40
41
42
43
44
45
46
47
48
49
50
51
52
53
54
55
56
57
58
59
60
61
62
63
64
65
66
67
68
69
70
71
72
73
74
75
76
77
78
79
80
81
82
83
84
85
86
87
88
89
90
91
92
93
94
95
96
97
98
99
100
101
102
103
104
105
106
107
108
109
110
111
112
113
114
115
116
117
118
119
120
121
122
123
124
125
126
127
128
129
130
131
132
133
134
135
136
137
138
139
140
141
142
143
144
145
146
147
148
149
150
151
152
153
154
155
156
157
158
159
160
161
162
163
164
165
166
167
"""
    EMC32 Plain Text Reader
    Vanadium
    2023
    diyfromscratch.eu
"""

import struct
import matplotlib
import matplotlib.pyplot

"""
    List of input files. Chage the following 6 variables as you need
"""
NOFCFRPLOT = 4
LEN_HEADER = 30
COLORS = ["blue","orange","green","red","purple","brown","pink","gray","olive","cyan",]

FOLDERUPPER = ["foldername1",
                "foldername2",
                "foldername3",
                "foldername4",
               ""]
FOLDERLOWER = ["OPmode0",
               "OPmode0",
               "OPmode0",
               "OPmode0"]
ANTENNAORIENT = "V"
FILENAME = "Result Table_%c AVG_CLRWR.Result"

"""
    Manip Input File
"""
def managePlotData(fn):
    fp = open(fn,"r")
    bulkdata = fp.read()
    fp.close()
    bulkdata = bulkdata.replace("\x00","")
    bulkdata = bulkdata.split("\n")
    for el in bulkdata:
        if el=="":
            bulkdata.remove(el)
    matrix = bulkdata[LEN_HEADER:]
    data = []
    x_f = []
    y_pk = []
    y_avg = []
    for line in matrix:
        if line=="":
            continue
        tmp = line.split("\t")
        data.append(tmp)
        col0=float(tmp[0])
        col1=float(tmp[1])
        col2=float(tmp[2])
        x_f.append(col0)
        y_pk.append(col1)
        y_avg.append(col2)
    return [x_f,y_pk,y_avg]

"""
    Plot Data
"""
fig0, axs0 = matplotlib.pyplot.subplots(2,2,sharex=True,sharey=True)
fig0.canvas.manager.set_window_title('EMC32-PlainTextReader')
i = 0
delta = 20
while i<NOFCFRPLOT:
    try:
        fn1v = "./"+FOLDERUPPER[i]+"/"+FOLDERLOWER[i]+"/"+FILENAME % ANTENNAORIENT
        fn1h = "./"+FOLDERUPPER[i]+"/"+FOLDERLOWER[i]+"/"+FILENAME % ANTENNAORIENT
        plot1 = managePlotData(fn1v)
        axs0[0,0].plot(plot1[0],plot1[1],label=FOLDERUPPER[i]+FOLDERLOWER[i]+"-PK")
        axs0[1,0].plot(plot1[0],plot1[2],label=FOLDERUPPER[i]+FOLDERLOWER[i]+"-AVG")
        maxval = max(plot1[1])
        maxind = plot1[1].index(maxval)
        maxfreq = plot1[0][maxind]
        axs0[0,0].plot(maxfreq,maxval,color=COLORS[i],marker='o')
        axs0[0,0].annotate(str(round(maxfreq,1))+","+str(round(maxval,1)),(maxfreq,maxval),(maxfreq+delta-20,12+5*(i%3)),arrowprops=dict(width=.1,headwidth=1))
        maxval = max(plot1[2])
        maxind = plot1[2].index(maxval)
        maxfreq = plot1[0][maxind]
        axs0[1,0].plot(maxfreq,maxval,color=COLORS[i],marker='o')
        axs0[1,0].annotate(str(round(maxfreq,1))+","+str(round(maxval,1)),(maxfreq,maxval),(maxfreq+delta-20,12+5*(i%3)),arrowprops=dict(width=.1,headwidth=1))

        plot1 = managePlotData(fn1h)
        axs0[0,1].plot(plot1[0],plot1[1],label=FOLDERUPPER[i]+FOLDERLOWER[i]+"-PK")
        axs0[1,1].plot(plot1[0],plot1[2],label=FOLDERUPPER[i]+FOLDERLOWER[i]+"-AVG")
        maxval = max(plot1[1])
        maxind = plot1[1].index(maxval)
        maxfreq = plot1[0][maxind]
        axs0[0,1].plot(maxfreq,maxval,color=COLORS[i],marker='o')
        axs0[0,1].annotate(str(round(maxfreq,1))+","+str(round(maxval,1)),(maxfreq,maxval),(maxfreq+delta-20,12+5*(i%3)),arrowprops=dict(width=.1,headwidth=1))
        maxval = max(plot1[2])
        maxind = plot1[2].index(maxval)
        maxfreq = plot1[0][maxind]
        axs0[1,1].plot(maxfreq,maxval,color=COLORS[i],marker='o')
        axs0[1,1].annotate(str(round(maxfreq,1))+","+str(round(maxval,1)),(maxfreq,maxval),(maxfreq+delta-20,12+5*(i%3)),arrowprops=dict(width=.1,headwidth=1))

        axs0[0,0].set_ylim([10, 80])
        axs0[1,0].set_ylim([10, 80])
        axs0[0,1].set_ylim([10, 80])
        axs0[1,1].set_ylim([10, 80])
        axs0[0,0].set_xlim([25, 450])
        axs0[1,0].set_xlim([25, 450])
        axs0[0,1].set_xlim([25, 450])
        axs0[1,1].set_xlim([25, 450])
    except:
        print("PLOT%i: File not found. Aborting..." % i)
        exit()
    delta += 5
    i += 1

"""
    Plot TL81000-2021 Limits
"""
axs0[0,0].plot([30,75,400,1000],[52,42,53,53],'b--')
axs0[1,0].plot([30,75,400,1000],[52,42,53,53],'b--')
axs0[0,1].plot([30,75,400,1000],[52,42,53,53],'b--')
axs0[1,1].plot([30,75,400,1000],[52,42,53,53],'b--')
axs0[0,0].plot([174,241],[34,34],'b--')
axs0[1,0].plot([174,241],[34,34],'b--')
axs0[0,1].plot([174,241],[34,34],'b--')
axs0[1,1].plot([174,241],[34,34],'b--')
axs0[0,0].plot([76,108],[24,24],'b--')
axs0[1,0].plot([76,108],[24,24],'b--')
axs0[0,1].plot([76,108],[24,24],'b--')
axs0[1,1].plot([76,108],[24,24],'b--')

axs0[0,0].plot([30,75,400,1000],[62,52,63,63],'g--')
axs0[1,0].plot([30,75,400,1000],[62,52,63,63],'g--')
axs0[0,1].plot([30,75,400,1000],[62,52,63,63],'g--')
axs0[1,1].plot([30,75,400,1000],[62,52,63,63],'g--')
axs0[0,0].plot([174,241],[44,44],'r--')
axs0[1,0].plot([174,241],[44,44],'r--')
axs0[0,1].plot([174,241],[44,44],'r--')
axs0[1,1].plot([174,241],[44,44],'r--')
axs0[0,0].plot([76,108],[31,31],'r--')
axs0[1,0].plot([76,108],[31,31],'r--')
axs0[0,1].plot([76,108],[31,31],'r--')
axs0[1,1].plot([76,108],[31,31],'r--')

"""
    Draw Legend
"""
axs0[0,0].legend(loc="upper right",fontsize="10")
axs0[1,0].legend(loc="upper right",fontsize="10")
axs0[0,1].legend(loc="upper right",fontsize="10")
axs0[1,1].legend(loc="upper right",fontsize="10")
axs0[0,0].set(xlabel="Frequency [MHz]", ylabel="Vert Level [dBuV/m]")
axs0[1,0].set(xlabel="Frequency [MHz]", ylabel="Vert Level [dBuV/m]")
axs0[0,1].set(xlabel="Frequency [MHz]", ylabel="Horiz Level [dBuV/m]")
axs0[1,1].set(xlabel="Frequency [MHz]", ylabel="Horiz Level [dBuV/m]")
axs0[0,0].set_title("VERTICAL")
axs0[0,1].set_title("HORIZONTAL")
axs0[0,0].grid(visible=True,which='both')
axs0[1,0].grid(visible=True,which='both')
axs0[0,1].grid(visible=True,which='both')
axs0[1,1].grid(visible=True,which='both')

"""
    Set Scale
"""
axs0[0,0].set_xscale('log')
axs0[1,0].set_xscale('log')
axs0[0,1].set_xscale('log')
axs0[1,1].set_xscale('log')
fig0.show()
Bit plotter
Sometimes EMC32 saves data as a bit stream according to a specific setting to save disk space. The following script, similar to the previous one, allow you to read those result files. Some lines are commented out to let you understand what you should modify if you want to add figures to make more comparisons at once.
0
1
2
3
4
5
6
7
8
9
10
11
12
13
14
15
16
17
18
19
20
21
22
23
24
25
26
27
28
29
30
31
32
33
34
35
36
37
38
39
40
41
42
43
44
45
46
47
48
49
50
51
52
53
54
55
56
57
58
59
60
61
62
63
64
65
66
67
68
69
70
71
72
73
74
75
76
77
78
79
80
81
82
83
84
85
86
87
88
89
90
91
92
93
94
95
96
97
98
99
100
101
102
103
104
105
106
107
108
109
110
111
112
"""
    EMC32 Binary Format Reader
    Vanadium
    2023
    diyfromscratch.eu
"""

import struct
import matplotlib
import matplotlib.pyplot

"""
    List of input files. Chage the following 5 variables as you need
"""
NOFCFRPLOT = 4
COLORS = ["blue","orange","green","red","purple","brown","pink","gray","olive","cyan",]

FOLDERUPPER = ["foldername1",
               "foldername2",
               "foldername3",
               "foldername4",
               ""]
FOLDERLOWER = ["opmode2",
                "opmode2",
                "opmode2",
                "opmode2"]
FILENAME = "Ergebnistabelle.Result"

def managePlotData(fn):
    fp = open(fn,"rb")
    bulkdata = fp.read()
    fp.close()
    f = 0
    i = 0
    x = []
    y_1 = []
    y_2 = []
    headindex = bulkdata.find(b'\xff\xff\xff\xff\x04\x00\x00\x00\x4e\x7e\x00\x00')
    bulkdata = bulkdata[headindex+12:]
    while f!=1000000000:
        row = bulkdata[i*40:i*40+40]
        f = (struct.unpack('<d',row[0:8]))[0]
        pk = (struct.unpack('<d',row[8:16]))[0]
        qpk = (struct.unpack('<d',row[16:24]))[0]
        x.append(float(f))
        y_1.append(float(pk))
        y_2.append(float(qpk))
        i = i + 1
    return [x,y_1,y_2]

fig0, axs0 = matplotlib.pyplot.subplots(2,1,sharex=True,sharey=True)
fig0.canvas.manager.set_window_title('EMC32-BinaryFormatReader')
i = 0
while i<NOFCFRPLOT:
    print("./"+FOLDERUPPER[i]+"/"+FOLDERLOWER[i]+"/"+FILENAME)
    plot1 = managePlotData("./"+FOLDERUPPER[i]+"/"+FOLDERLOWER[i]+"/"+FILENAME)
    axs0[0].plot(plot1[0],plot1[1],label=FOLDERLOWER[i])
    axs0[1].plot(plot1[0],plot1[2],label=FOLDERLOWER[i])
    i += 1

"""
    Plot TL81000-2021 Limits
"""
axs0[0].plot([30000000,75000000,400000000,1000000000],[52,42,53,53],'b--')
axs0[1].plot([30000000,75000000,400000000,1000000000],[52,42,53,53],'b--')
#axs0[0,1].plot([30000000,75000000,400000000,1000000000],[52,42,53,53],'b--')
#axs0[1,1].plot([30000000,75000000,400000000,1000000000],[52,42,53,53],'b--')
axs0[0].plot([174000000,241000000],[34,34],'b--')
axs0[1].plot([174000000,241000000],[34,34],'b--')
#axs0[0,1].plot([174000000,241000000],[34,34],'b--')
#axs0[1,1].plot([174000000,241000000],[34,34],'b--')
axs0[0].plot([76000000,108000000],[24,24],'b--')
axs0[1].plot([76000000,108000000],[24,24],'b--')
#axs0[0,1].plot([76000000,108000000],[24,24],'b--')
#axs0[1,1].plot([76000000,108000000],[24,24],'b--')

axs0[0].plot([30000000,75000000,400000000,1000000000],[62,52,63,63],'g--')
axs0[1].plot([30000000,75000000,400000000,1000000000],[62,52,63,63],'g--')
#axs0[0,1].plot([30000000,75000000,400000000,1000000000],[62,52,63,63],'g--')
#axs0[1,1].plot([30000000,75000000,400000000,1000000000],[62,52,63,63],'g--')
axs0[0].plot([174000000,241000000],[44,44],'r--')
axs0[1].plot([174000000,241000000],[44,44],'r--')
#axs0[0,1].plot([174000000,241000000],[44,44],'r--')
#axs0[1,1].plot([174000000,241000000],[44,44],'r--')
axs0[0].plot([76000000,108000000],[31,31],'r--')
axs0[1].plot([76000000,108000000],[31,31],'r--')
#axs0[0,1].plot([76000000,108000000],[31,31],'r--')
#axs0[1,1].plot([76000000,108000000],[31,31],'r--')

"""
    Draw Legend
"""
axs0[0].legend(loc="upper right",fontsize="10")
axs0[1].legend(loc="upper right",fontsize="10")
#axs0[0,1].legend(loc="upper right",fontsize="10")
#axs0[1,1].legend(loc="upper right",fontsize="10")
axs0[0].set(xlabel="Frequency [MHz]", ylabel="Vert Level [dBuV/m]")
axs0[1].set(xlabel="Frequency [MHz]", ylabel="Vert Level [dBuV/m]")
#axs0[0,1].set(xlabel="Frequency [MHz]", ylabel="Horiz Level [dBuV/m]")
#axs0[1,1].set(xlabel="Frequency [MHz]", ylabel="Horiz Level [dBuV/m]")
axs0[0].grid(visible=True,which='both')
axs0[1].grid(visible=True,which='both')
#axs0[0,1].grid(visible=True,which='both')
#axs0[1,1].grid(visible=True,which='both')

"""
    Set Scale
"""
axs0[0].set_xscale('log')
axs0[1].set_xscale('log')
#axs0[0,1].set_xscale('log')
#axs0[1,1].set_xscale('log')
fig0.show()
Share this page


Comments
Be polite and respectful in the comments section. In case of doubts, read this before posting.
Posted comments ⮧
Comment section still empty.
INDEX
INFO
STATISTICS
CONTACTS
SHARE